Snorting The Future
SQL Server 2019 introduced batch mode over row store, which allows for batch mode processing to kick in on queries when the optimizer deems it cost effective to do so, and also to open up row store queries to the possibility of Adaptive Joins, and Memory Grant Feedback.
These optimizer tricks have the potential to help with parameter sniffing, since the optimizer can change its mind about join strategies at run time, and adjust memory grant issues between query executions.
But of course, the plan that compiles initially has to qualify to begin with. In a way, that just makes parameter sniffing even more frustrating.
I Hate Graphic Tees
But I like this demo. It’s got some neat stuff going on in the plan, and that neat stuff changes depending on what you look for.
I also like it because it returns a small number of rows overall. I’ve gotten complaints in the past that queries that return lots of rows are unrealistic.
Moving on.
Here’s The Procedure
CREATE OR ALTER PROCEDURE dbo.DisplayNameSearch
	     (
	         @DisplayName NVARCHAR(40)
	     )
	AS
	    BEGIN

			SELECT TOP 1000
				   u.Id,
				   u.DisplayName,
				   SUM(u.Reputation) AS Reputation,
				   SUM(CASE WHEN p.PostTypeId = 1 THEN p.Score END ) AS QuestionsScore,
				   SUM(CASE WHEN p.PostTypeId = 2 THEN p.Score END ) AS AnswersScore
			FROM dbo.Users AS u
			JOIN dbo.Posts AS p
			ON p.OwnerUserId = u.Id
			WHERE u.DisplayName LIKE @DisplayName
			AND EXISTS (SELECT 1/0 FROM dbo.Badges AS b WHERE b.UserId = p.OwnerUserId)
			GROUP BY u.Id, u.DisplayName
			ORDER BY Reputation DESC

	    END;
	GO
Here’s The Indexes
CREATE INDEX ix_posts_helper ON dbo.Posts (OwnerUserId, Score) WITH (SORT_IN_TEMPDB = ON);

CREATE INDEX ix_users_helper ON dbo.Users (DisplayName, Reputation) INCLUDE (PostTypeId) WITH (SORT_IN_TEMPDB = ON);

CREATE INDEX ix_badges_helper ON dbo.Badges (UserId) WITH (SORT_IN_TEMPDB = ON);
Parameter Sniffing Problem
My favorite user in the Users table is Eggs McLaren. If I wanted to find Eggs, and users like Eggs, I could run my proc like this:
EXEC dbo.DisplayNameSearch @DisplayName = N'Eggs%'
It finishes pretty quickly.
Table 'Worktable'. Scan count 0, logical reads 0, physical reads 0, read-ahead reads 0, lob logical reads 0, lob physical reads 0, lob read-ahead reads 0.
Table 'Posts'. Scan count 11, logical reads 48, physical reads 0, read-ahead reads 0, lob logical reads 0, lob physical reads 0, lob read-ahead reads 0.
Table 'Badges'. Scan count 17, logical reads 72, physical reads 0, read-ahead reads 0, lob logical reads 0, lob physical reads 0, lob read-ahead reads 0.
Table 'Users'. Scan count 1, logical reads 5, physical reads 0, read-ahead reads 0, lob logical reads 0, lob physical reads 0, lob read-ahead reads 0.

 SQL Server Execution Times:
   CPU time = 0 ms,  elapsed time = 2 ms.
The plan for it is what you’d expect for a small number of rows. Nested Loops. Kinda boring. Though it has a Batch Mode operator way at the end, for some reason.

Flight of the Navigator
I say “for some reason” because I’m not sure why batch mode is a good option for one batch of 9 rows. It might just be in there as a safeguard for memory adjustments.
But hey, I’m just a bouncer.
If the next thing we look at is for users who didn’t register a proper handle on the site, we can run this query:
EXEC dbo.DisplayNameSearch @DisplayName = N'user[1-2]%'
We might even find this guy:

Hello, new friend!
The plan doesn’t change a whole lot, except that now we have a couple spills, and they’re not even that bad. If we run the users query a couple more times, the memory grant stuff will iron out. Kind of. We’ll look at that in a minute.

Tripped, fell
The metrics for this one are way different, though. We do a ton more reads, because we get stuck in Nested Loops hell processing way more rows with them.
Table 'Worktable'. Scan count 0, logical reads 0, physical reads 0, read-ahead reads 6249, lob logical reads 0, lob physical reads 0, lob read-ahead reads 0.
Table 'Posts'. Scan count 200450, logical reads 641628, physical reads 0, read-ahead reads 2, lob logical reads 0, lob physical reads 0, lob read-ahead reads 0.
Table 'Badges'. Scan count 507356, logical reads 1619439, physical reads 0, read-ahead reads 1, lob logical reads 0, lob physical reads 0, lob read-ahead reads 0.
Table 'Users'. Scan count 1, logical reads 2526, physical reads 0, read-ahead reads 0, lob logical reads 0, lob physical reads 0, lob read-ahead reads 0.

 SQL Server Execution Times:
   CPU time = 3593 ms,  elapsed time = 5051 ms.
Five Seconds Doesn’t Seem Bad
To most people, it wouldn’t be, but it depends on your expectations, SLAs, and of course, which set of parameters more closely resembles typical user results.
Especially because, if we recompile and run it for users first, we do much better. Far fewer reads, and we trade 30ms of CPU time for about 3.5 seconds of elapsed time.
Table 'Users'. Scan count 1, logical reads 2526, physical reads 0, read-ahead reads 0, lob logical reads 0, lob physical reads 0, lob read-ahead reads 0.
Table 'Badges'. Scan count 5, logical reads 43941, physical reads 0, read-ahead reads 0, lob logical reads 0, lob physical reads 0, lob read-ahead reads 0.
Table 'Posts'. Scan count 5, logical reads 105873, physical reads 0, read-ahead reads 0, lob logical reads 0, lob physical reads 0, lob read-ahead reads 0.
Table 'Worktable'. Scan count 0, logical reads 0, physical reads 0, read-ahead reads 0, lob logical reads 0, lob physical reads 0, lob read-ahead reads 0.
Table 'Worktable'. Scan count 0, logical reads 0, physical reads 0, read-ahead reads 0, lob logical reads 0, lob physical reads 0, lob read-ahead reads 0.

 SQL Server Execution Times:
   CPU time = 3626 ms,  elapsed time = 1601 ms.
Even Eggs is in okay shape using the ‘big’ plan. Yes, metrics are up a bit compared to the small plan, but I still consider a quarter of a second pretty fast, especially since we do so much better with the users plan.
Table 'Users'. Scan count 1, logical reads 5, physical reads 0, read-ahead reads 0, lob logical reads 0, lob physical reads 0, lob read-ahead reads 0.
Table 'Badges'. Scan count 5, logical reads 43941, physical reads 0, read-ahead reads 0, lob logical reads 0, lob physical reads 0, lob read-ahead reads 0.
Table 'Posts'. Scan count 17, logical reads 94, physical reads 0, read-ahead reads 0, lob logical reads 0, lob physical reads 0, lob read-ahead reads 0.
Table 'Worktable'. Scan count 0, logical reads 0, physical reads 0, read-ahead reads 0, lob logical reads 0, lob physical reads 0, lob read-ahead reads 0.
Table 'Worktable'. Scan count 0, logical reads 0, physical reads 0, read-ahead reads 0, lob logical reads 0, lob physical reads 0, lob read-ahead reads 0.

 SQL Server Execution Times:
   CPU time = 985 ms,  elapsed time = 261 ms.
Most of the reason for this is the adaptive join between Users and Posts.

Avedsay Atinlay
See, in the old days, we didn’t get that adaptive join, and when Eggs used the users plan, it would take about 2 seconds. There was a static hash join, and the startup cost and hashing process really stunk for a small number of rows.
This is a point in favor of batch mode, and adaptive joins, I think. But like I said, this is also what makes it more frustrating — if parameterized plans were treated with a little more suspicion, this post would have been over hours ago.
Is It All Sunshine And Daisies?
No, not at all. Batch Mode Memory Grant Feedback could still use some help.
See, when there are big swings, it has a hard time figuring out a good middle ground. It tries too hard to make each correction perfect for the last execution.
Here’s an example using the big plan for users.
The first time it runs, there are no spills, but it requests 1.1 GB of memory, and only uses 112 MB of memory.
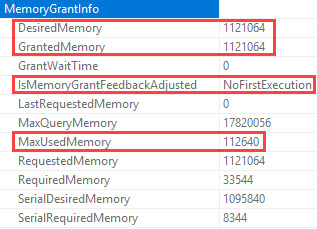
Good times, that.
Running it again for users, we see a downward adjustment in requested memory.
This is good; there are still no spills. Our request dropped to 167 MB.

Proud of you, kiddo!
But if we run it for Eggs a few times now, the memory grant will swing way lower.

This ain’t gonna be good, Jim.
We’re down to a 34 MB memory grant, which of course means when we run users again…

Spanish Fly
We spill in four different places, and elapsed time shoots up to 16 seconds.
Table 'Users'. Scan count 1, logical reads 2526, physical reads 0, read-ahead reads 0, lob logical reads 0, lob physical reads 0, lob read-ahead reads 0.
Table 'Badges'. Scan count 5, logical reads 43941, physical reads 0, read-ahead reads 0, lob logical reads 0, lob physical reads 0, lob read-ahead reads 0.
Table 'Posts'. Scan count 5, logical reads 105525, physical reads 0, read-ahead reads 0, lob logical reads 0, lob physical reads 0, lob read-ahead reads 0.
Table 'Worktable'. Scan count 0, logical reads 0, physical reads 0, read-ahead reads 0, lob logical reads 0, lob physical reads 0, lob read-ahead reads 0.
Table 'Worktable'. Scan count 0, logical reads 0, physical reads 0, read-ahead reads 0, lob logical reads 0, lob physical reads 0, lob read-ahead reads 0.

 SQL Server Execution Times:
   CPU time = 3547 ms,  elapsed time = 16135 ms.
Though I do wanna take a moment to thank whomever added Adaptive Join spill information to query plans. I don’t think that was there before.
I appreciate you.
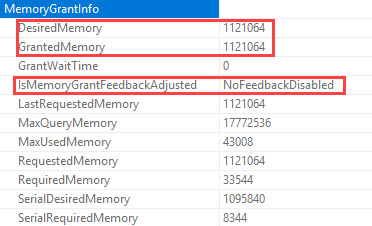
But if we keep running those procs, eventually this will happen (32 oscillations is the number I’ve been given for calling it quits). We’re back to the original grant, and feedback won’t attempt to adjust it again, unless the plan leaves the cache for some reason.
I can quit you.
What Can We Do About Memory Grant Feedback?
The rest of the caches in the SQL Server memory (procedure cache, thread stack, backup buffers etc) consumes memory outside buffer pool memory. The memory consumed by caches outside buffer pool is not restricted by above memory limits and can grow up to limits defined by “max server memory”. This is not specific to SQL Server 2016 SP1 and is also applicable to earlier releases of SQL Server as well.
Batch Mode vs Parameter Sniffing
There is definitely some improvement here, via adaptive joins, but memory grant feedback still needs work.
I used to really hate hints like optimize for unknown, or for a value, but it may be worth exploring in these cases to always get a medium or large plan. Getting the bigger plan with the Adaptive Join saves us trouble switching between large and small.
For instance, adding this stabilizes the plan to the large one:
OPTION(OPTIMIZE FOR (@DisplayName = N'user[1-2]%'));
But the memory grant still swings wildly. In order to make that more stable, we have to do something like this:
OPTION
    (
    OPTIMIZE FOR (@DisplayName = N'user[1-2]%'),
    MIN_GRANT_PERCENT = 1.0,
    MAX_GRANT_PERCENT = 1.5
    );
But if we’re going to play tricks with knobs like this, we’d better know our data, and our queries, very well.
Here at Brent Ozar Unlimited, we love us some good knobs.
Heck, some of our best friends are knobs.
Our last employee of the month was a knob.
But the more knobs we have, the more chances we have to screw stuff up. Just ask the knobs at Oracle.
Thanks for reading!